
Over the years, I’ve worked with dozens of companies and witnessed QA Engineering teams implement (or wanting to implement) Testing Automation. While some QA teams have a very mature library of automated tests, others are just getting their feet wet. What I’ve seen missing the majority of times is the integration of test automation with Continuous Integration & Delivery (CI / CD) Pipelines and Reporting. If teams integrate with CI/CD pipelines, then more often than not the QA Automation Reports from these jobs are never shared with other teams, peers or management. This leads to a false perception created within the organization that there is no QA Automation or that it’s unreliable. This happens because no one can see what the Automation is doing besides the QA Engineer who runs the tests on their laptop or Jenkins. The engineering and management team need to be able to trust the QA Automation that is put in place, and in order to build that trust sharing, exposing reports, and making them easily accessible every time test automation is executed is imperative.
I’ve also observed frequently there is lack of knowledge, skills, and experience in the QA team around how to work with CI/CD tools and in many cases a lack of support from the CI/CD or DevOps teams to setup the automation jobs. Setting up QA Automation Jobs on Jenkins often requires installing the necessary tools and dependencies on your Jenkins servers such as Chrome Drivers, BrowserMob proxies, and any pre-requisites required by the automation framework. Often the QA team members don’t have the know-how or permissions to install and configure these plugins and have to rely on the teams responsible for managing Jenkins. We strongly recommend QA Automation teams closely collaborate with DevOps engineers when setting up the QA Automation jobs to install and configure the necessary plugins and dependencies. Once you’ve successfully setup your jobs, the next important step is to ensure that the wider team is notified anytime the test automation is executed and reports are made accessible.
In this blog post, I’ll be showcasing some plugins and approaches you can take to make reports from your jobs accessible to your peers without making them jump through hoops such as downloading zips or files from some shared drives, Jenkins servers, or digging through their emails.
Accessing test automation reports should be a seamless and 1 click affair.
Expose your test execution reports via Jenkins
HTML Publisher Plugin
One of the most commonly used plugins in Jenkins is the HTML Publisher Plugin.
If your automation framework generates an HTML Report you can easily expose it by adding the Publish HTML Reports post build step to your Jenkins.
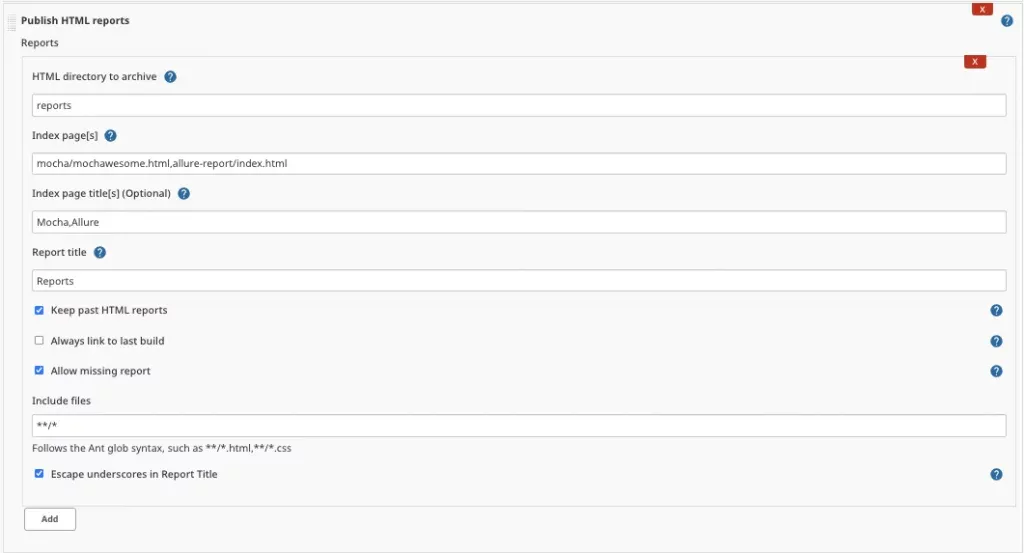
This plugin supports adding multiple tabs to your reports as well. For e.g. if your automation framework generates multiple reports you can put links to multiple index pages which appear as tabs. You can also archive the reports with each build thus, allowing your users to access reports for previous builds.
Once you’ve configured this plugin you’ll see a reports link on your job after you’ve run your build.
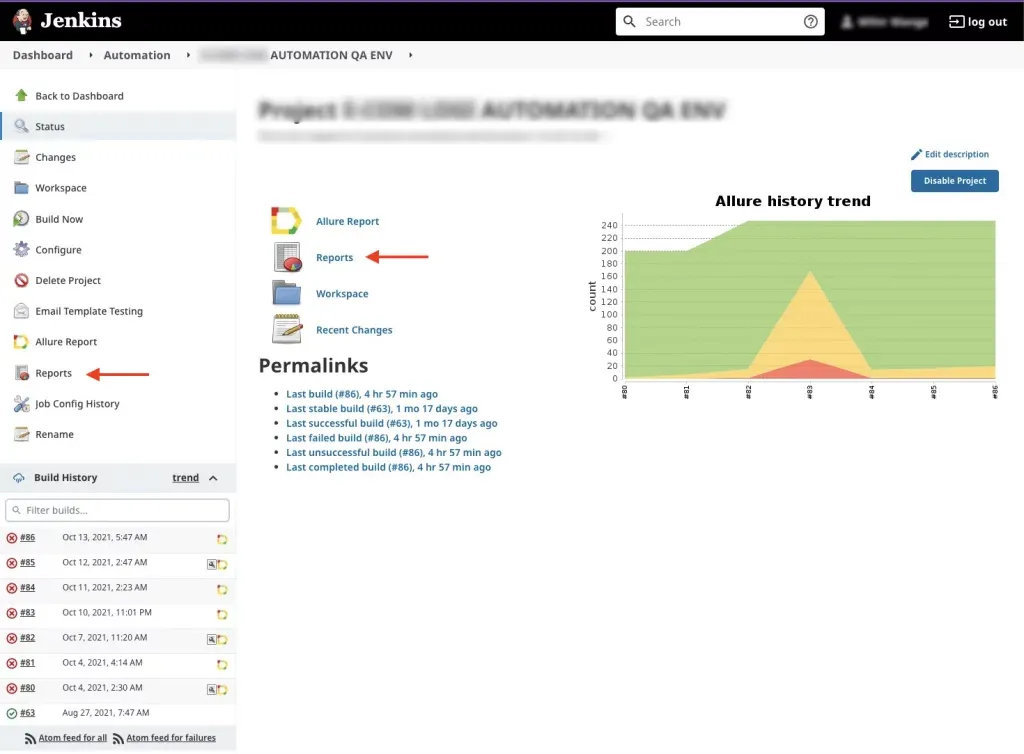
Clicking on these links will allow the user to directly see the report on Jenkins without having to download any zip files. On the reports page, you’ll see tabs if you configured multiple reports.
The HTML Publisher plugin is a generic plugin that allows publishing a folder containing HTML reports on Jenkins and the majority of the QA Automation Frameworks such as Selenium, Cucumber, Mocha, Cypress, etc. All generate HTML Reports which can be easily made accessible on Jenkins itself.
Cucumber Report Example
In the below example we’ve linked Multiple reports – Cucumber + Allure via the HTML Publisher plugin.:
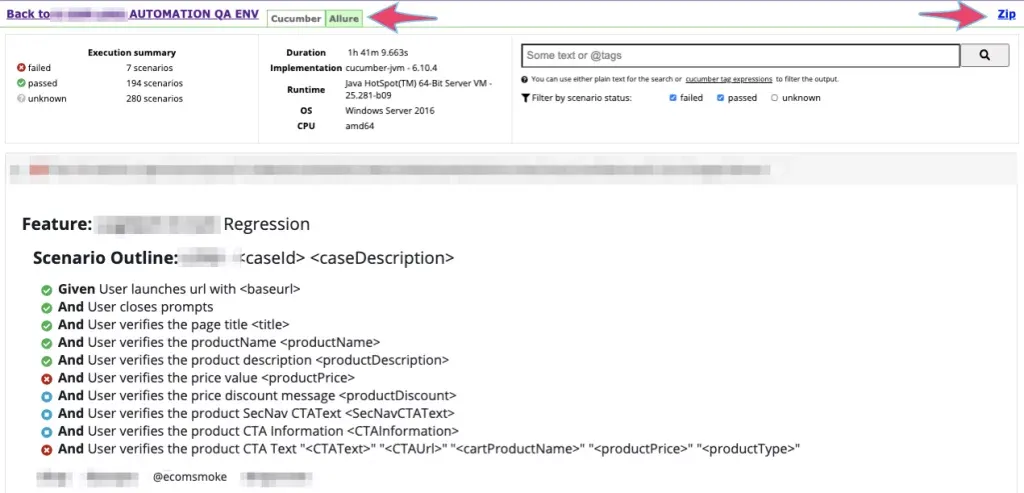
The Cucumber HTML report can show passes and failures in Jenkins itself as shown in this screenshot below:
Mocha Report Example
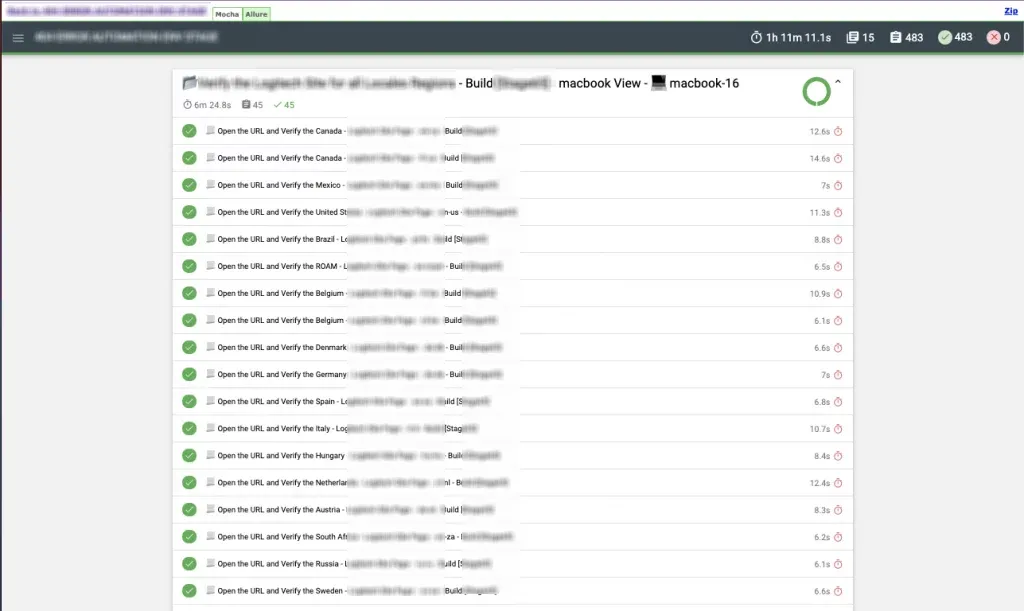
In the below example we’ve linked Multiple reports – Mocha + Allure via the HTML Publisher plugin:
Robot Framework
Robot Framework is another QA Automation framework that is often used to create test cases. Robot Framework Plugin for Jenkins allows you to easily expose and show your test case results directly in Jenkins.
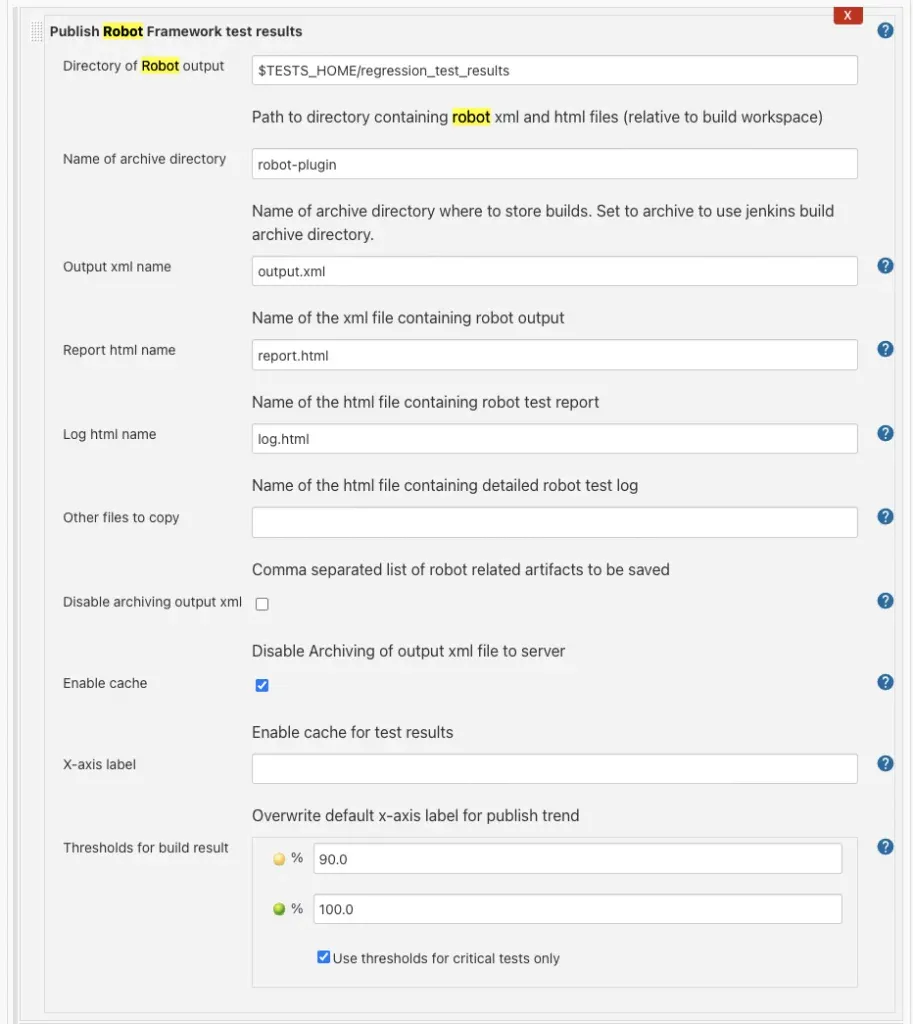
Once you’ve configured the Publish Robot Framework Test Results in post-build steps, you can see the status report of your test execution directly on the job.
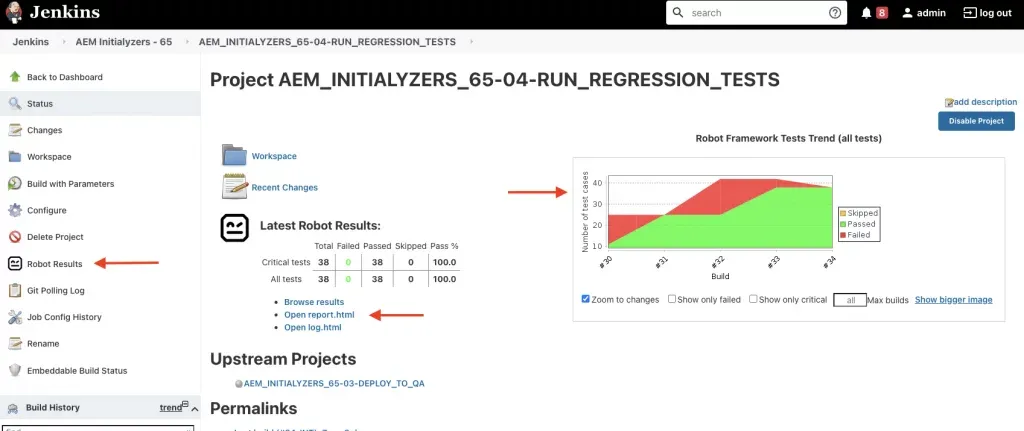
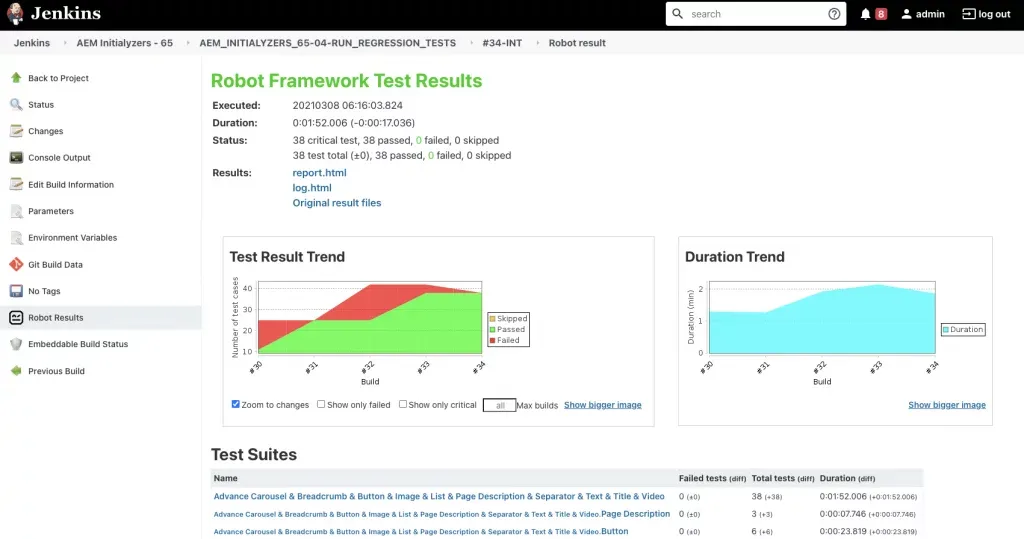
You can also drill into the reports directly within Jenkins without having to download anything.
Allure Plugin
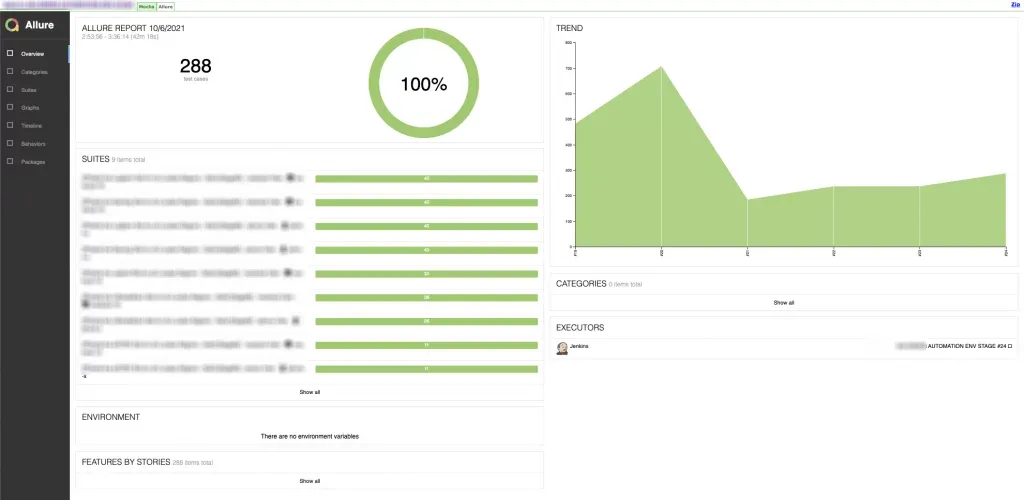
Allure is an excellent reporting framework that QA Automation teams leverage to provide a good representation of the test executions. Jenkins has a plugin for Allure reports. Generally, Allure doesn’t generate an HTML report so this Jenkins plugin allows you to generate the HTML report from your Allure xUnit results.
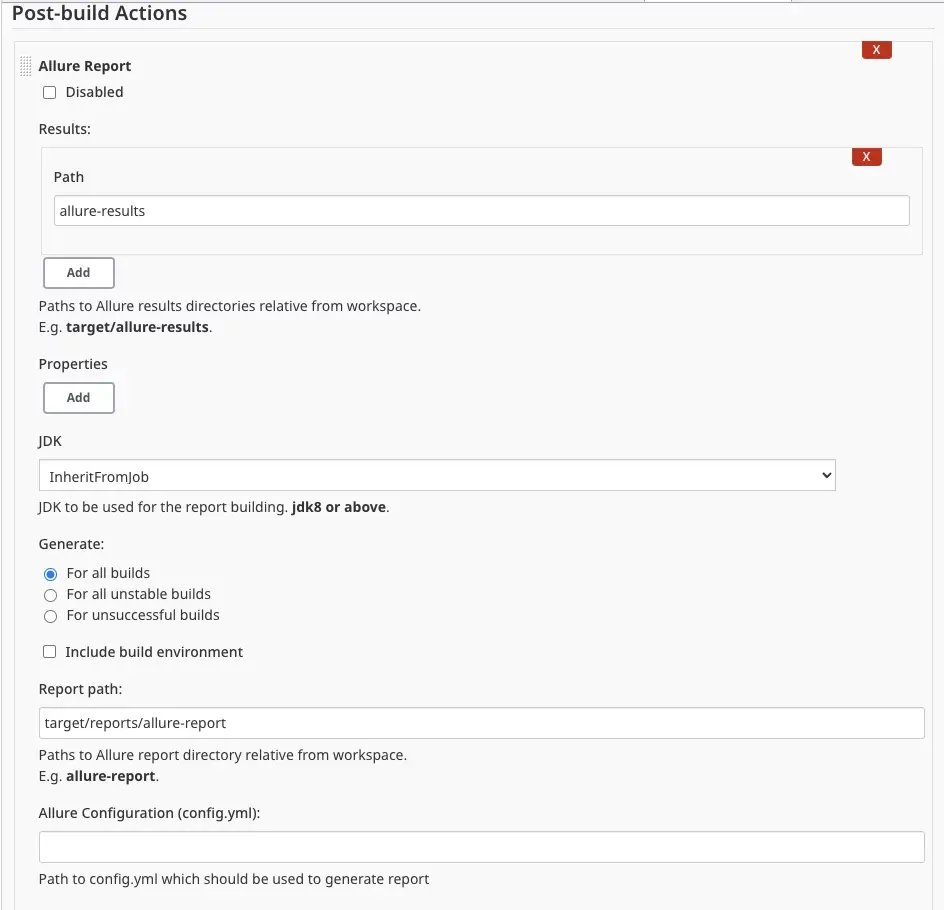
Once you’ve configured this plugin as part of your post-build actions and run a build, you should see Links to the Allure Report on your job.
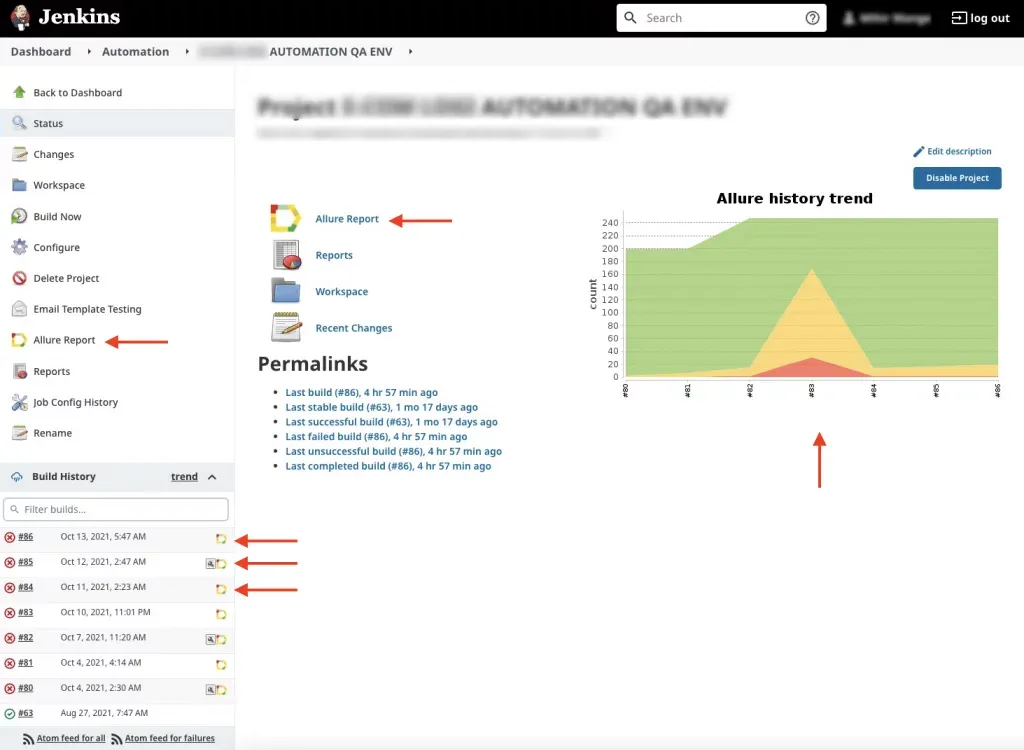
The allure reports are actually really nice, visual, and informative and you can directly see them in Jenkins w/o having to download or run anything locally as shown below. You can even have the HTML Publisher plugin link to the Allure Report as a tab allowing your users to switch between the Allure report and other reports.
Notify your teams when Tests are Run
By notifying your developers and leadership team via Slack (or whatever collaboration tool your team uses) and giving them 1 Click Links to directly open the reports you can provide visibility and transparency to your stakeholders on how the automated tests are doing.
This will go a long way in building trust and supporting conversation with the Leadership team around the ROI of Automation when everyone is able to see the reliability and value that the Automated tests are bringing.
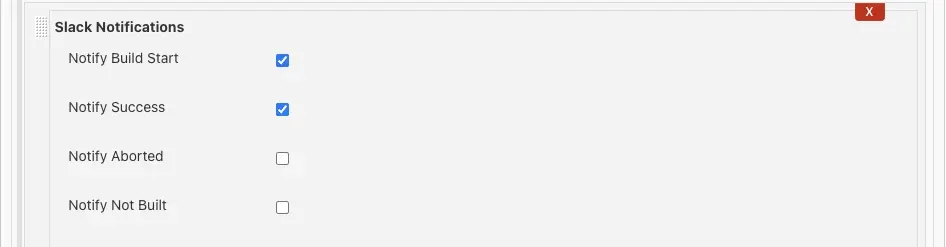
Configure Slack Notifications with Jenkins
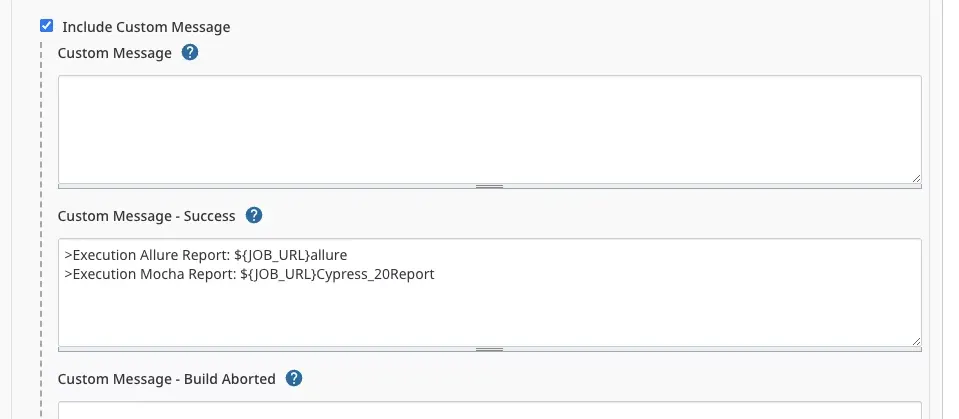
Use Custom Message to provide direct links to Automation Report
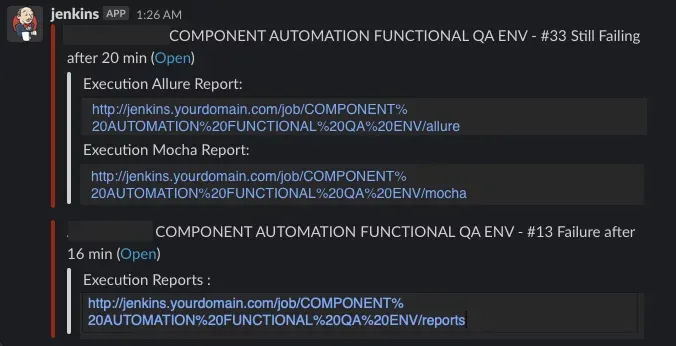
You can use the Advance features of the Slack plugin to add a custom message with direct links to the reports published by the HTML Publisher plugin.
Preview of Slack Notification
Troubleshooting – Viewing HTML Reports
Enabling Jenkins to serve up the HTML Reports properly sometimes requires relaxing or configuring the Content Security Policy (CSP) settings.
If you are having trouble viewing your HTML Publisher or Reports via Jenkins or you are seeing a blank page try opening up your Chrome > Developer tools and inspecting console errors.
If you are seeing errors related to sandbox or Content Security Policy, you can try the following:
Quick Fix CSP (temporary)
This is a temporary fix you can apply by working with a Jenkins Admin to test if it will resolve your issue.
Go to Manage Jenkins > Script Console – run the following:
System.setProperty("hudson.model.DirectoryBrowserSupport.CSP", "default-src 'self'; img-src 'self' data: blob:; style-src 'self' 'unsafe-inline'; child-src 'self'; frame-src 'self'; script-src 'self' 'unsafe-inline';")
Alternatively, you can also set the CSP to empty as follows:
System.setProperty("hudson.model.DirectoryBrowserSupport.CSP", "")
Once the above has been applied, try reloading your report (make sure you clear cache).
Once you have figured out the CSP Policy that worked you can work with your Jenkins Administrator to make the fix permanently.
Permanently Fixing Jenkins CSP
You can find instructions for this via online search as this really varies depending on how your Jenkins server is started but, one of the most common solutions is to update the JENKINS_JAVA_OPTIONS setting as follows:
/etc/alternatives/java -Dcom.sun.akuma.Daemon=daemonized -Dhudson.model.DirectoryBrowserSupport.CSP=default-src 'self'; img-src 'self' data: blob:; style-src 'self' 'unsafe-inline'; child-src 'self'; frame-src 'self'; script-src 'self' 'unsafe-inline'; -DJENKINS_HOME=/var/lib/jenkins -jar /usr/lib/jenkins/jenkins.war --logfile=/var/log/jenkins/jenkins.log --webroot=/var/cache/jenkins/war --daemon --httpPort=8080 --debug=5 --handlerCountMax=100 --handlerCountMaxIdle=20
The goal is to pass the Java command that starts your Jenkins a -D flag with the right set of values for Jenkins CSP setting as shown above.
At Initialyze, we have deep expertise in creating and setting up Testing Automation effectively. We have helped multiple large enterprises implement automation using technologies such as Selenium, Robot Framework, Cypress, TestNG, Functionize, and even built Custom Excel based frameworks. Are you looking for support or guidance with using Test or QA Automation? Contact, Call or email us now to schedule a demo and learn how we can help.
About Initialyze
Founded in 2015 in San Francisco, Initialyze specializes in providing software solutions and services to help the world’s leading brands deliver transformation digital brand experiences. Our expertise includes Digital Strategy, Technology Implementation, Analytics, and Marketing. We strive to form strong partnerships with our clients to envision, design, and build innovative digital experiences efficiently and simply. Using an optimized implementation process and a suite of ready to use Initialyzers, we deliver on complex requirements quickly and cost effectively without sacrificing on quality.